An in-depth overview of the timeline of the rapid nuclear meltdown at the Fukushima reactor 1, including temperature data, water levels and the state of the fuel rods as the crisis unfolded.
EX-SKF points us to TEPCO’s press release today explaining the sequence of events that led to the rapid nuclear meltdown of the Fukushima nuclear reactor 1.
TEPCO’s Analysis of Reactor 1 Core Meltdown
From their press release, their English.
It’s in “secure” mode, and I can’t even do the screen capture. Take a look at page 3 and page 4.
The temperature reached the core melting temperature in about 4 hours, when the water level dropped to the bottom of the fuel. From there, nothing could stop the melt, all of it.
As EX-SKF points out the press release is a “secure” PDF, in that it does not allow copying or saving of images. I took the liberty of extracting the contents of the press release, both the full text and the graphics inside of the PDF and have included it here so the information can be more readily distrubuted on the web.
The the individual pieces of content are presented here in a step by step walk through of the entire TEPCO’s explanation of events surrounding the full-blown nuclear meltdown. For objectivity’s sake the full slides of the original press release follow.
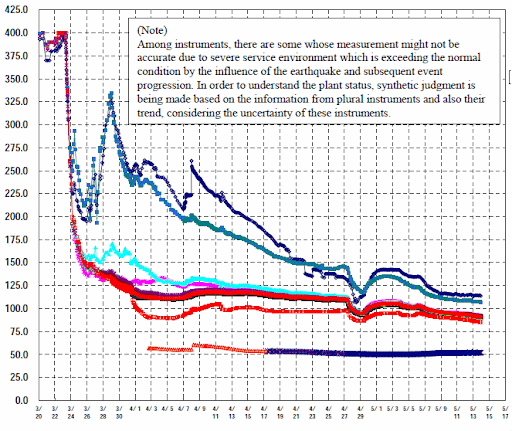
Japan Nuclear Meltdown – Fukushima Reactor 1 Reported RPV Temperatures
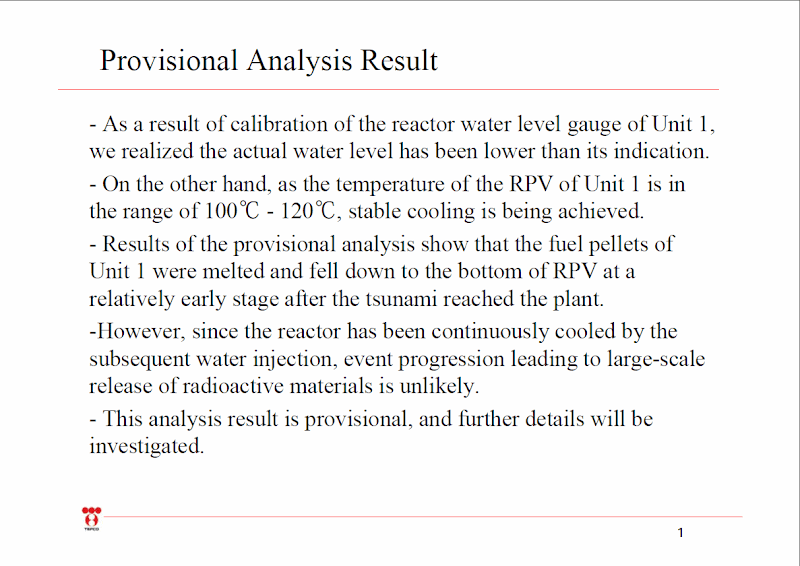
Provisional Analysis Result
- As a result of calibration of the reactor water level gauge of Unit 1, we realized the actual water level has been lower than its indication
- On the other hand, as the temperature of the RPV of Unit 1 is in the range of 100 degrees Celsius-120 degrees Celsius stable cooling is being achieved.
- Results of the provisional analysis show that the fuel pellets of Unit 1 were melted and fell down to the bottom of RPV at a relatively early stage after the tsunami reached the plant
- However, since the reactor has been continuously cooled by the subsequent water injection, event progression leading to large-scale release of radioactive materials is unlikely
- This analysis result is provisional, and further details will be investigated
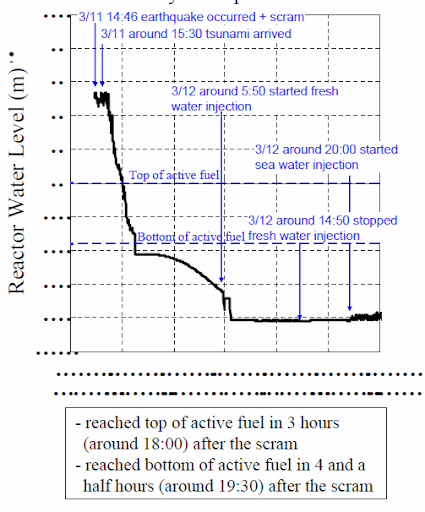
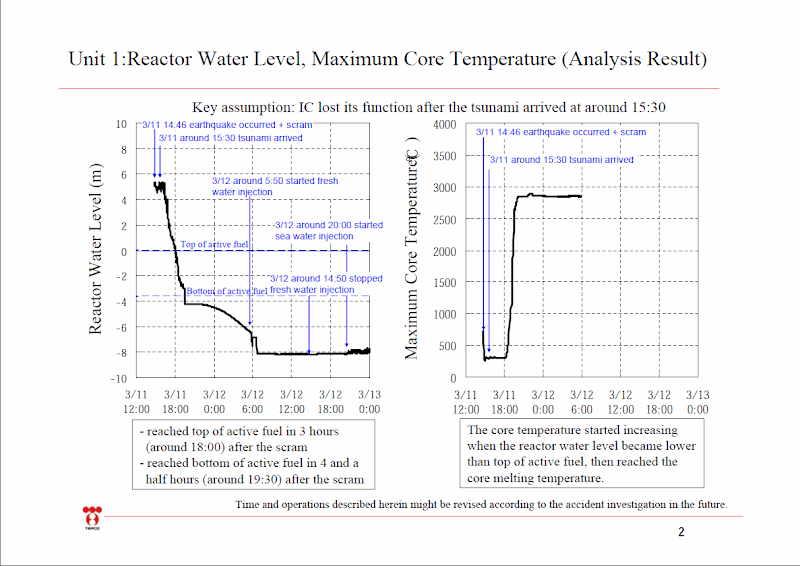
Unit 1: Reactor Water Level, Maximum Core Temperature (Analysis Result)
Key assumption: IC (Internal Cooling) lost its function after the tsunami arrived at around 15:30
Breakdown of the reactor water levels.
-Reached the top of the active fuel rod within 3 hours of the scram
-Water Level dropped below the bottom of the fuel rods within 4 1/2 hours.
- 3/11 14:46 earthquake occurred + scram – Water Level 5 Meters Above Top of Active Fuel
- 3/11 around 15:30 tsunami arrived – Water Level 5 Meters Above Top of Active Fuel
- 3/11 around 18:00 – Water Level Drops To Top Of Active Fuel
- 3/11 around 20:00 – Water Level Drops To Below The Active Fuel
- 3/12 around 5:50 started fresh water injection – Water Level 7 Meters Below Active Fuel
- 3/12 around 6:45 – Water Level dropped to 8 Meters Below Fuel Rods – TEPCO Thought Gauges Were Malfunctioning, But Level Was Actually So Low The Gauge Could Not Measure it
- 3/12 around 14:50 stopped fresh water injection – Water Level 8 Meters Below Active Fuel.
- 3/12 around 20:00 started sea water injection – Water Level 8 Meters Below Active Fuel
Breakdown of the Temperature Levels In the Reactor.
-The core temperature started increasing when the reactor water level became lower than top of active fuel (18:00) and then reached the core melting temperature. [Shooting all the way to almost 3000 Degrees Celsius within 2 hours which was about the time the water level dropped below the fuel rods].
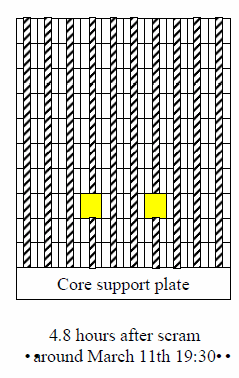
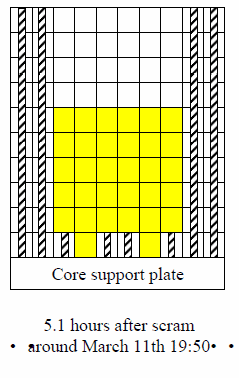
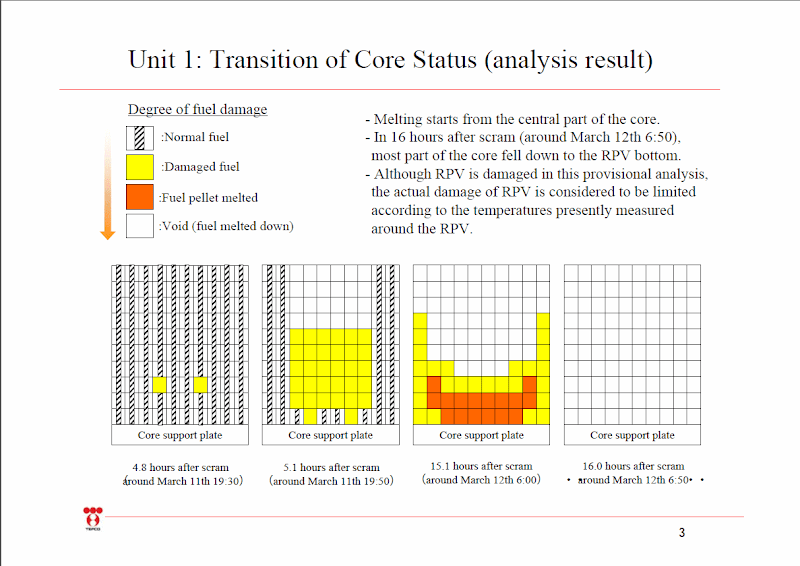
Timeline of the Nuclear Meltdown in the Reactor Core.
The Core started nuclear meltdown by 19:30, or 4.8 hours after scram, as the water level transitioned from the top of the Fuel rods at 18:00 to completely below the fuel rods at 20:00.
By 19:50 or 5.1 hours after scram, within 20 minutes of the water dropping below the top of the fuel rods, the large part of the fuel had become damaged as the temperature shot to nearly 3000 degrees Celsius.
With temperatures being far above the fuel rods melting point a majority of the Fuel pellets had melted by 06:00, or approximately 15.1 hours after scram which was approximately the time fresh water injections began.
The injection of fresh water did not halt the meltdown in progress. By 6:50, 16 hours after scram, or 1 hour after the injections began the fuel rods had become completed meltdown.
TEPCO downplays the damage to the Reactor Pressure Vessel (RPV) Core:
- Melting starts from the central part of the core
- Within 16 hours after scram (around March 12th 6:50), most part of the core fell down to the RPV bottom.
- Although RPV is damaged in this provisional analysis, the actual damage of RPV is considered to be limited according to the around the RPV.
But as we all know tons of water every day is being injected into the reactor which is leaking right through holes in the reactor. It has been calculated, by TEPCO in fact, that the size of the hole in the reactor must be at least 16cm wide to leak the amount of water being lost from the nuclear reactor core.
Estimate based on the Actual Temperatures around RPV
- The temperatures around RPV are being measured by differently-located instruments and the indications of operable instruments show a similar trend or temperatures.
- Most part of heat generating materials (fuels) are considered to be submerged in the bottom of RPV and some part exposed.
- Fuel pellets melted in the early stages but water injection was subsequently performed into the reactor and each part of the temperature has been steadily decreased after March 23th when measurement was started.
- Since the pressures of RPV and PCV fluctuate in accordance with water injection rate into the reactor, the core exists in the reactor and this is the influence of the generated steam therein.
- RPV temperature is around 100 degrees Celsius to 120 degrees Celsius and the core is stably cooled.
- Feed water nozzle temperature is relatively high and this is considered to be the influence of the generated superheated steam from where some part of fuels are exposed in RPV
- Leak of cooling water from RPV is likely, but significant damage to the RPV bottom is not likely.
- Significant increase of reactor water level is not confirmed although water injection has been continued.
- Temperatures of upper and lower part of CRD housing and also RPV bottom can be measured
and they are showing a similar tend of temperature.- Therefore, considering the above, the fuels are considered to be sufficiently cooled inside the RPV.
Obviously, the assessment is packed full of contradictory statements which can mean only one of two things.
The first possibility is that TEPCO is lying and there is in fact significant damage to the RPV which is allowing the water to leak at rate which is preventing the fuel rods from cooling, hence the continuous rise of water levels in the basement and the lack thereof inside the reactors.
The other possibility let us suppose that the RPV is not badly damaged. Then where could the tons of water being injected daily possibly be going? The only possible explanation would a nuclear meltdown raging so hot inside the reactor that the water being sprayed inside of it is being immediately being evaporated and producing literally tons of radioactive steam which is then being shot into the atmosphere on a daily basis.
At the end of the day, while we do see radioactive steam and smoke coming from the reactors from time to time, the observation is not continuous and not consistent with the constant with constant steam and smoke being released from the injection of water into the reactor. This leads us to the most likely conclusion that TEPCO is lying about the amount of damage the RPV has sustained and the water loss is primarily through the reactor core and the sporadic clouds of steam and smoke are from fires and periodic overheating at the plant.
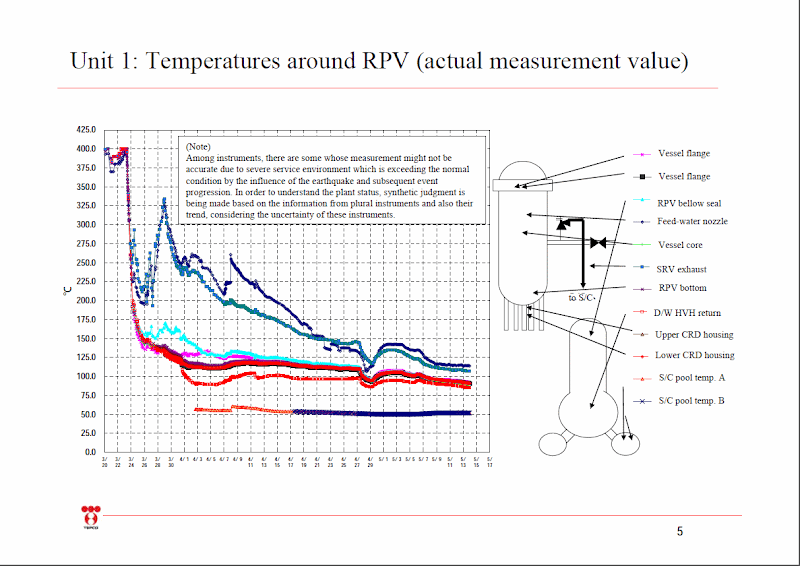
Unit 1: Temperatures around the Reactor Pressure Vessels (Reported Actual RPV Measurement Values)
Finally we get to TEPCO’s reported measurements of the temperatures around the RPV which of course comes with a disclaimer of possible inaccuracy – a justification of why they are making up bullshit numbers and reporting them.
The disclaimer clearly states we are reporting the temperatures we expect to see even though we can’t get actual temperatures from the instruments. This follows along the same lines as TEPCO reporting their own fictitious water levels in the reactors while stating the gauges weren’t working. In fact, we find out today by that the gauges were working the entire time in showing levels below their range of measurement which TEPCO incorrectly assumed and assured the public could not be possible. So instead of making their calculations on the water levels being 8 meters below the fuel rods, they assumed the fuel rods were completely covered in water and reported the water levels they “expected” were in the reactors.
Here is their exact disclaimer
(Note) Among instruments, there are some whose measurement might not be accurate due to severe service environment which is exceeding the normal condition by the influence of the earthquake and subsequent event progression.
In order to understand the plant status, synthetic judgment is being made based on the information from plural instruments and also their trend, considering the uncertainty of these instruments
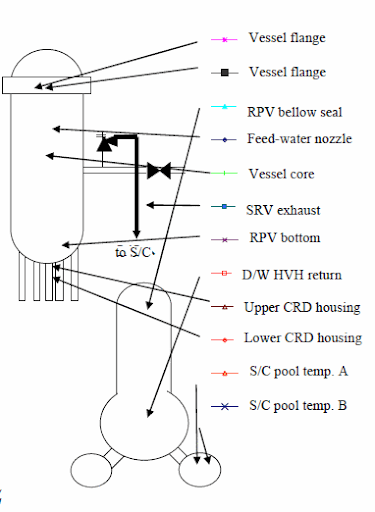
The Legend of the Temperatures Measured.
And the graph of the reactor pressure vessel temperatures TEPCO is reporting to have measured around the Fukushima reactor 1 RPV.
The Slides From the Original TEPCO Press Release — Unadulterated
Source: In-Depth Techical Overview Of The Rapid Nulclear Meltdown At Fukushima Reactor 1 ©
Copying or redistribution of this material requires that this license must remain intact with attribution to the content source.



No comments:
Post a Comment